Module 9: Mapping
Note that this feature may be disabled in your organization. If it is, you may need to contact your IT department to enable it. If you are using a personal account, you may also need to check your Power BI settings or tenant configuration before the visuals will work properly.
Maps
Maps are one of the most useful visual types in Power BI when your data contains geographic information. A map visual takes location data such as a country, state, city, postal code, or latitude/longitude and plots it on a geographic surface. This makes it much easier to spot patterns, compare regions, and understand spatial relationships that might be hidden in a table or standard chart.
This is especially helpful when you are analyzing sales by city, customer locations, store coverage, delivery areas, service demand, or population trends. Instead of just seeing raw numbers, you can see where the numbers are happening.
For example, if a business has sales data by region, a map can quickly show whether performance is concentrated in a single city, across a whole country, or spread across multiple states. That can lead to better decisions around expansion, staffing, marketing, and product demand.
Map visuals are also useful for layered storytelling. You can show one measure as bubble size and another as color intensity, giving the audience multiple data points at a glance.
Pie charts can be added to maps, but they are not always the clearest choice for geographic analysis.
This can make a map look visually interesting, but it is often less effective than a simple bubble or filled map when the goal is to compare volume or density. It can be useful for a dashboard demo, but for analytical reporting, cleaner map encodings usually work better.
By Population:
When a map is colored or sized by population, it becomes much easier to compare not only the number of records, but the relative size or significance of each area. This is helpful when comparing rural versus urban concentration, or when a business wants to understand whether certain markets are large enough to justify investment.
Formatting Maps
Power BI gives you several ways to format maps so that they communicate the right story. You can change the map type, switch to a satellite view, adjust the base map style, and update bubble size and bubble color. You can also tie bubble size and bubble color to measures, making the map more informative than a simple locator map.
The map can also be configured to zoom automatically or to remain static. Auto-zoom is useful when users are filtering the data and you want the map to respond immediately to the current selection. A static map can be useful when you want a fixed geographic perspective for a dashboard layout or for storytelling.
For example, if a user selects Kentucky, the map can automatically zoom to that state. If they select the United States, it zooms out to show the entire country. If they select the whole world, it zooms out fully to show global patterns. The same principle applies to countries, states, cities, postal codes, and even addresses, depending on the level of detail in the data.
This is especially valuable for drill-down experiences. A map can start at the country level, then drill into states, then cities, then postal codes, creating a natural progression from broad patterns to detailed location analysis.
World Wrap is a useful concept when a map might appear to show duplicate regions because of how the map projection works. In some cases, a map can visually repeat the same area across the boundary of the map. This is not necessarily a data issue; it is often a display projection issue. You may see a second version of a country or region because the map is wrapping around the longitude boundaries.
A heatmap is another way of showing geographic density. Unlike a bubble map, which uses circles at specific point locations, a heatmap colors areas based on the concentration of data points. The more data points in a given area, the darker or more intense the color becomes. This is effective for identifying hotspots, clusters, and concentration patterns.
Heatmaps are often useful for analyzing customer density, incident frequency, store clusters, social media activity, or disease tracking. A bubble map may be better when you want to show exact locations and relative magnitudes; a heatmap is better when the main question is "where is the activity most concentrated?"
Adding Data Categories
Before Power BI can plot data accurately on a map, the fields should be classified correctly. This is done through Data Categories. For example, a field can be categorized as City, State, Country, Postal Code, or Latitude/Longitude. This tells Power BI how to interpret the values and which geographic mapping rules to apply.
If the data is not categorized correctly, the map may place points inaccurately or fail to plot them as expected. This is one of the most common reasons a map looks wrong even when the underlying data is correct.
For example, if a field contains country names, it should be classified as Country. If it contains state or province names, it should be classified as State or Province. If it contains cities, then City should be used. Postal codes should be categorized appropriately as Postal Code. Once these categories are set, Power BI can use the correct geographic logic for the visual.
This is especially important when working with multiple geographic hierarchies. You might have CountryRegionCode, StateProvinceCode, City, and PostalCode all in the same dataset. If you categorize each field correctly, Power BI can accurately drill from a broad region down to a specific city or zip code.
The Data Category pane is often the difference between a map that looks useful and a map that is misleading. It is worth taking time to validate that each field is mapped to the right geographic role before building a final report.
Filled Maps and Conditional Formatting
A filled map is different from a bubble map. Instead of placing circles on a map, the geographic region itself is filled with a color based on a value. For example, a filled map of countries could be shaded based on sales, population, or customer count. The darker or more intense the color, the higher the value in that region.
This is a powerful way to compare performance by region without the visual clutter of individual points. It is especially useful when the question is about distribution across countries or states rather than exact locations.
A filled map works well for showing things like:
- total sales by country
- population by state
- number of customers by region
- market share by territory
Conditional formatting can take a filled map to the next level. Instead of using a single static color, you can apply a gradient or diverging palette based on a measure. For example, a map could use green for high values, yellow for medium values, and red for low values. This makes the differences between regions much easier to interpret.
In this example, the most populated areas are green and the least populated areas are red. Using a color scale like this makes the relative differences obvious to the viewer. It also helps tell a story quickly: low-performing regions appear in one color, while high-performing areas stand out in another.
It is important to be careful with color choices. Some viewers may be color blind, so a palette should not rely only on red and green when other differences are needed. A diverging scale with clear contrast, or a dataset that uses blue-to-yellow-to-green, can be easier to interpret for a wider audience.
When you combine bubble size, filled coloring, and conditional formatting together, you can create a rich geographic dashboard. For instance, a bubble layer can show the number of customers in each city, while a filled map can highlight regional differences. This gives viewers both a local and regional perspective in the same visual.
Combining these settings in a bubble layer provides both geographic location and a value-based visual encoding:
This makes the map more informative because it shows both where locations are and how important they are. The bubbles convey local detail, while the regional shading helps explain broader patterns.
ArcGIS Maps
ArcGIS maps are a more advanced mapping option in Power BI. They provide additional layers, richer basemaps, and more sophisticated spatial analysis capabilities than the standard map visual. ArcGIS is especially useful when you need more control over your map design, mapping tools, or geographic analysis.
You need to sign in to use ArcGIS maps, which means your organization or your personal account must be configured to allow this feature. In some environments, this may be controlled by IT policy or tenant settings. If the visual is disabled or unavailable, you may need to enable it through Power BI or ask an administrator for access.
ArcGIS maps are helpful when you want to combine your business data with geographic layers such as terrain, roads, boundaries, population, or other spatial datasets. They can help create more polished and informative maps for executive dashboards, field operations, and location strategy work.
The benefit is that you do not have to manually bring in every geographic layer yourself. Power BI can use ArcGIS data sources and map services that are already prepared, which saves time and improves accuracy.
The map can update using layers and data from ArcGIS, so every geographic layer does not need to be maintained manually in the report.
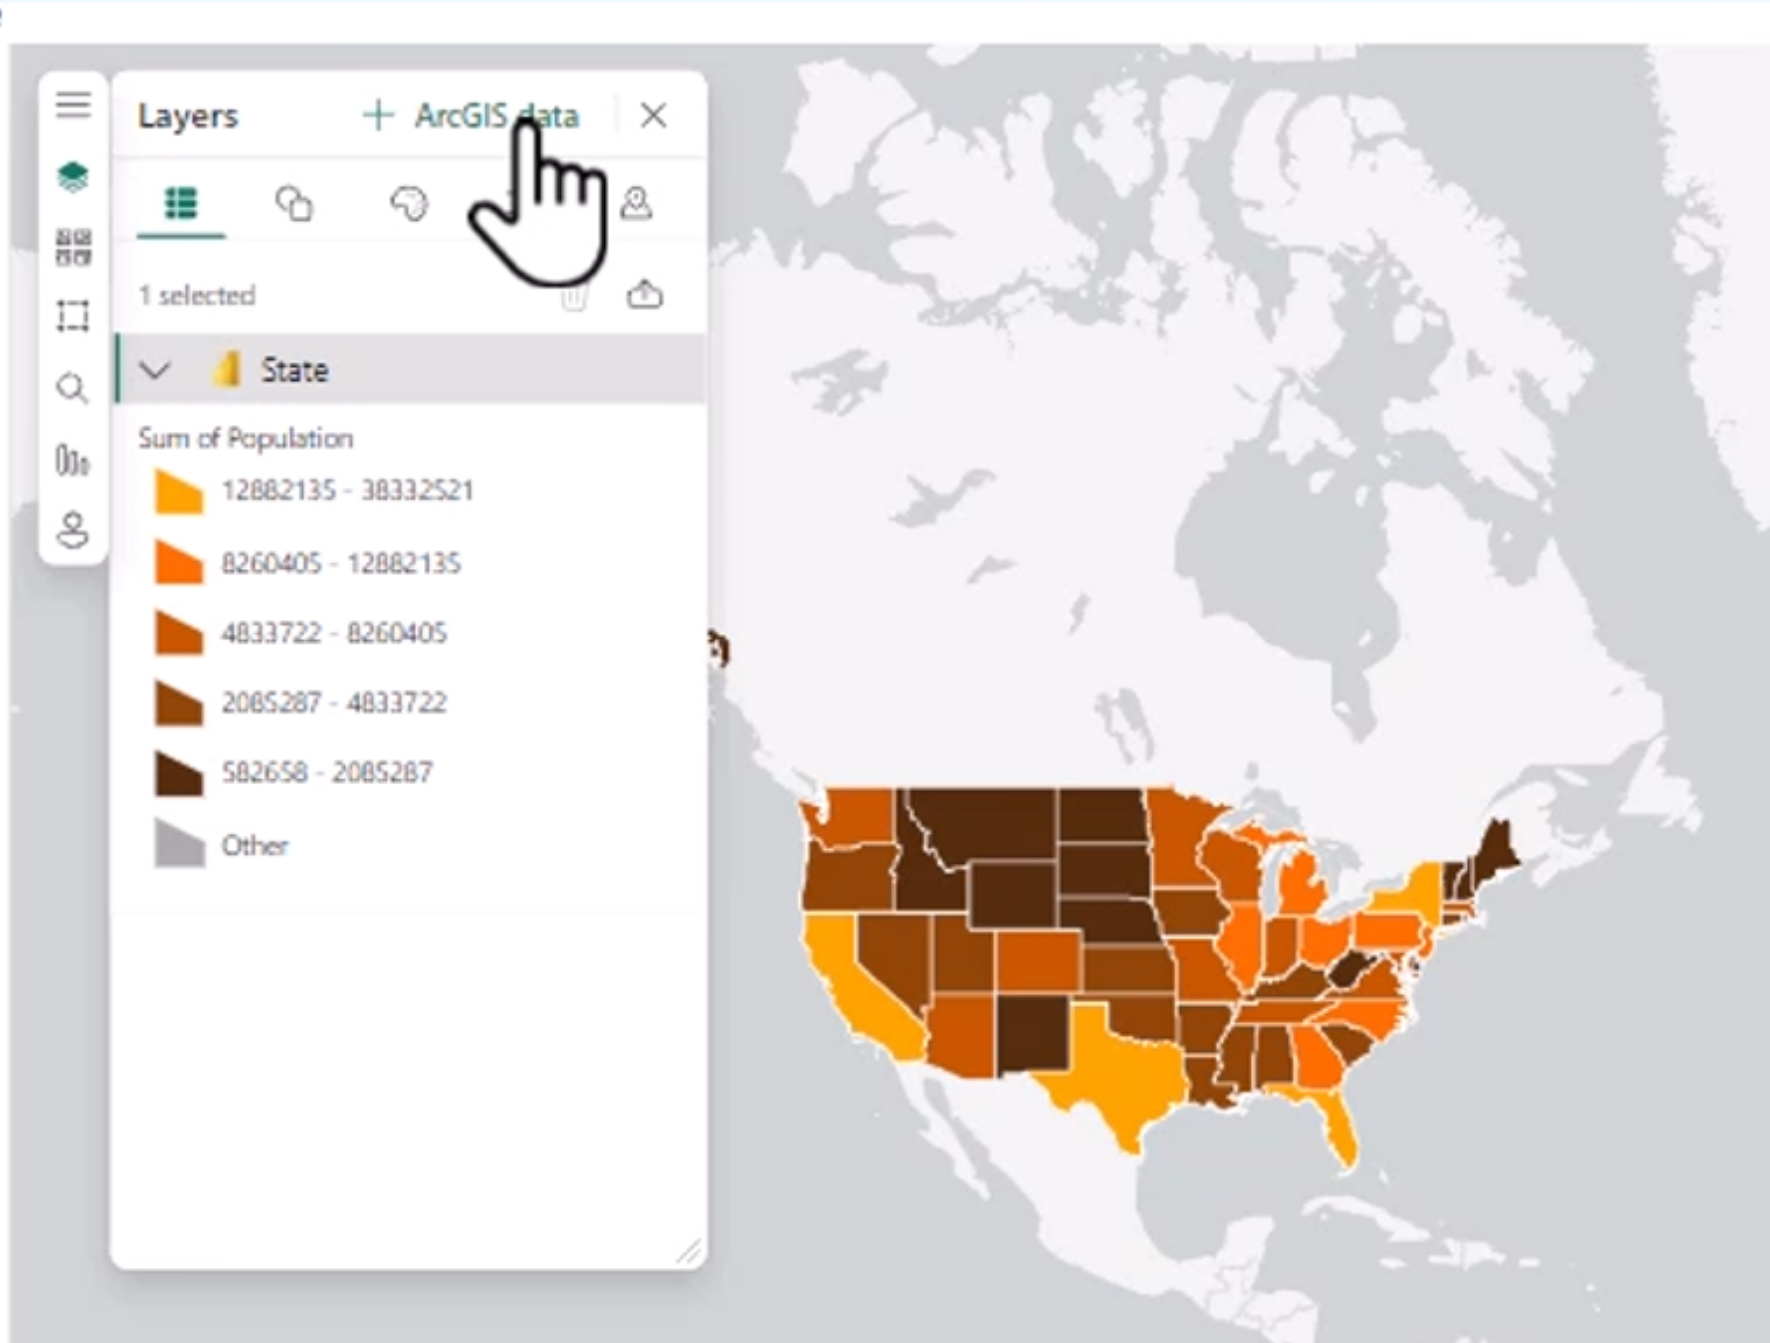
ArcGIS is often used when a report needs more advanced business mapping, especially in sectors like retail, logistics, public services, utilities, and real estate. It is a strong choice when a simple bubble or filled map does not provide enough context for decision-making.